
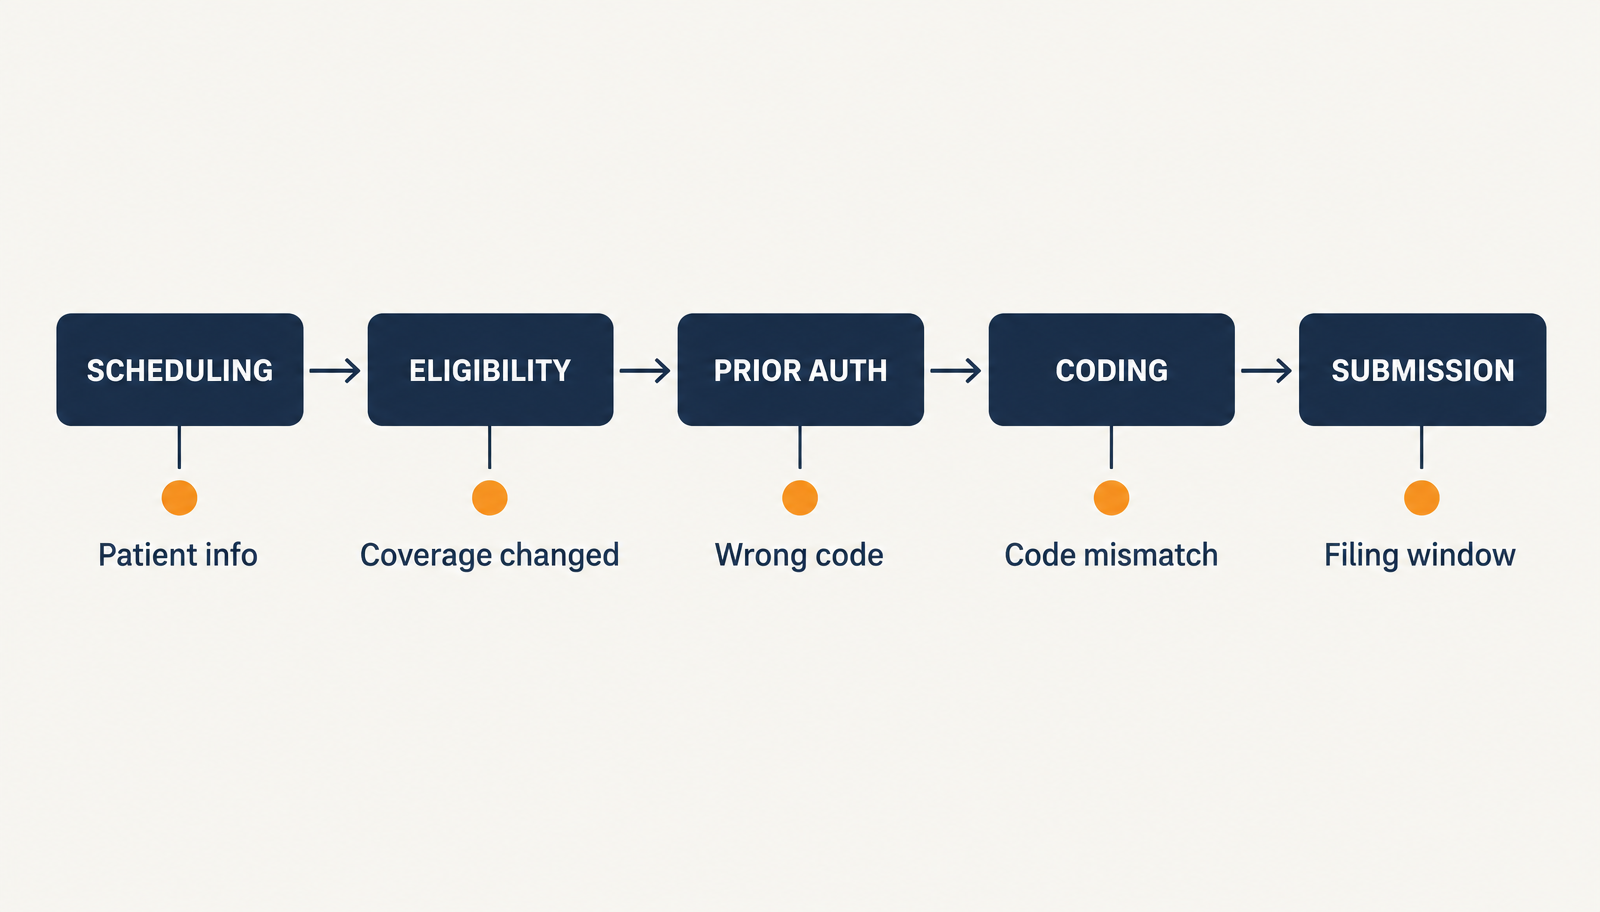
Most claim denials trace back to five causes: incorrect patient information, unverified eligibility, missing or mismatched prior authorization, coding that does not match the documentation, and claims that missed the filing window. Almost every one of them starts before the claim is ever submitted. That is why denials feel random when they are not. The pattern is usually sitting in your own denial codes, waiting to be read.
This is not a competence problem
If you are the person in the office who opens the remittance advice and sees the same rejection for the third time this month, this article is for you. Not the vendor version. The version that tells you what is actually happening and what you can check yourself.
Let's be clear about one thing first. This is not a competence problem. Denials are rising across the entire industry, at practices with excellent staff and practices with struggling staff alike. In the 2025 State of Claims survey of 250 revenue cycle leaders, 54% said claim denials were increasing, and 41% said at least one in ten claims was being denied. You are not doing this wrong. You are doing this inside a system that got harder.

The short answer: five causes account for most of it
Denial codes are written to sound technical. Underneath, nearly all of them are one of five things:
1. The patient information was wrong before the visit started
2. Eligibility was never verified, or it changed
3. Prior authorization was missing, late, or attached to the wrong code
4. The coding did not match what the documentation supports
5. The claim missed the filing deadline
Each one has a different fix and a different owner. Work through them in order.
Cause one: the patient information was wrong before the visit started
This is the least glamorous cause and the most common one. A transposed digit in a member ID. A maiden name on the insurance card and a married name in the chart. A secondary policy that terminated in January and nobody asked.
The 2025 State of Claims survey put missing or inaccurate data at the top of the list of denial causes, and 26% of respondents said roughly a tenth of their denials came from information collected incorrectly at patient intake.
Here is what makes this cause worth attacking first: it is the cheapest to fix. Nobody needs new software. The correction happens at the front desk, thirty seconds per patient.
What to check this week: pull your last twenty denials. Count how many are demographic or identification errors. If the number is above three, your intake script needs a rewrite, not your billing process.
Cause two: eligibility was never verified, or it changed
Coverage moves. Patients change jobs, plans change networks at renewal, dependents age off, Medicaid redeterminations drop people without warning. A patient who was covered in March is not automatically covered in September.
Administrative reasons accounted for 25% of stated denial reasons in the federal marketplace data reviewed by KFF for 2024, second only to the 'other' category.
The gap is usually process, not effort. Most offices verify at scheduling. Fewer verify again at check-in. For a patient booked six weeks out, those are two different insurance situations.
What to check this week: does your eligibility check happen once or twice? If once, that is the fix.
Cause three: prior authorization was missing, late, or attached to the wrong code
Prior authorization deserves its own section because the burden has grown faster than any staffing plan accounted for.
The American Medical Association's 2025 survey of 1,000 practicing physicians found an average of 40 prior authorizations per physician, per week, consuming about 13 hours of physician and staff time weekly. Forty percent of practices now have staff working exclusively on prior authorization. Ninety-five percent of physicians reported that prior authorization delays care.
You might be thinking: we do get the authorizations, and the claims still get denied. That is a real and separate problem. An authorization obtained for one CPT code does not cover a different code billed on the day of service. If the provider adds a procedure, changes the approach, or bills a higher level than what was authorized, the authorization no longer matches and the claim denies even though the work was approved.
In the KFF review of 2024 marketplace data, lack of prior authorization or referral was the stated reason on 9% of in-network denials.
What to check this week: on your prior-auth denials, compare the authorized code to the billed code. If they differ, the breakdown is between the clinical side and the billing side, and it is solvable with one shared step before the claim goes out.
Cause four: the coding did not match the documentation
Medical necessity denials are the ones that feel personal, because they read as though the payer is second-guessing the clinician. Sometimes that is exactly what is happening. More often the documentation simply did not carry the diagnosis specificity the code required.
Medical necessity was the stated reason on 5% of in-network denials in the 2024 marketplace data. That is a smaller share than most offices expect, but these denials carry higher dollar values and take the most work to appeal.
Modifier errors, unbundling, and diagnosis codes that do not support the procedure code fall in this same family.
What to check this week: group your medical necessity denials by provider. If they cluster with one clinician, the conversation is a documentation conversation, and it is much easier to have with data in hand than without.
Cause five: the claim missed the filing window
This one is quiet and permanent. Filing windows vary by payer and can run from 90 days to a full year. A claim that sat in a work queue during a staffing gap, or bounced between a clearinghouse rejection and a resubmission, can age past the window without anyone flagging it.
Once a timely filing denial lands, the appeal rarely succeeds, and the balance is usually not billable to the patient. That revenue is simply gone.
What to check this week: run an aging report and look at anything past 90 days. It will show you exactly which buckets are at risk and which payer deadlines are closest.
You are not imagining it. Denials really are rising.
It helps to see the scale, because the scale is the argument against blaming your own team.
In 2024, insurers on HealthCare.gov denied roughly 19% of in-network claims, about 85 million out of 451 million submitted. Across the 157 reporting insurers, denial rates ranged from 3% to 36%. Same rules, same country, ten times the variance depending on who you billed.
The number that should stop you: fewer than 1% of denied claims were appealed. And of the internal appeals that were filed, insurers upheld their original decision 66% of the time.
Read those two figures together. The appeal success rate is not great, but roughly one in three appealed denials was reversed, and almost nobody appealed. Money is being left on the table at the appeal step more than at the submission step.
What a denial actually costs your practice
The direct cost is the unpaid claim. The real cost is the second pass.
Every denial that gets worked consumes staff time that was already spoken for: pulling the record, identifying the cause, correcting, resubmitting, tracking, and often calling the payer and waiting on hold. A practice running a 10% denial rate is not running at 90% capacity. It is running its billing workflow close to twice on a tenth of its volume, with the same number of people.
That is the cost that shows up as burnout, backlog, and staff turnover long before it shows up on a financial statement.
How to find your own pattern in one afternoon
You do not need a consultant to do this. You need ninety minutes and your last ninety days of denials.
Step one. Export denials for the last 90 days with the denial code, payer, provider, and dollar amount.
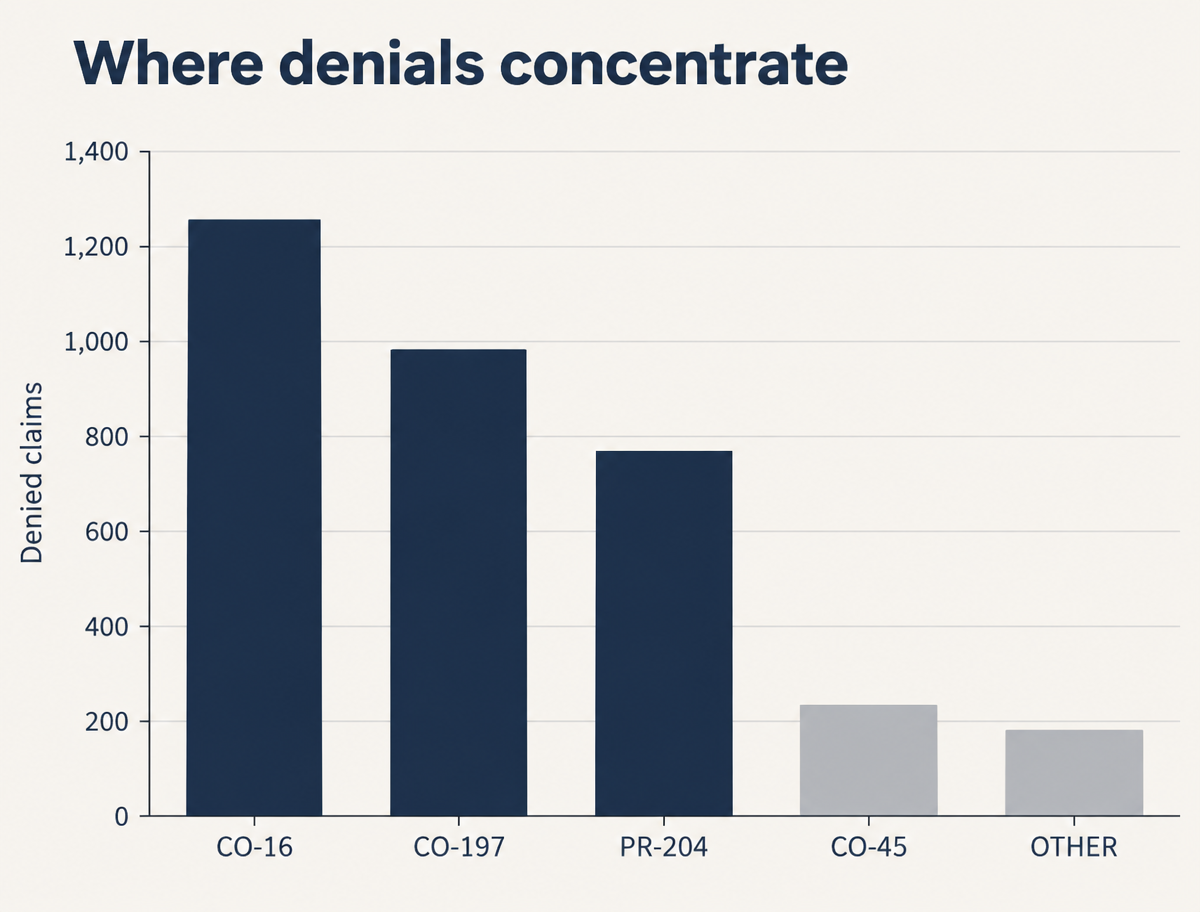
Step two. Sort by denial code and count. Nearly every practice finds that three or four codes account for most of the volume.
Step three. Take the top code and sort it by payer. If one payer dominates, you have a payer-specific rule problem. If it spreads evenly, you have an internal process problem.
Step four. Take the same code and sort it by provider and by front-desk staff member. Clustering tells you where to train.
Step five. Total the dollars attached to your top three codes. That number is what a fix could be worth over a year, and it is the number to bring to your practice owner.
Most offices that run this exercise find the same thing: the denials are not random, they are not evenly distributed, and a small number of causes account for a large share of the problem. That is good news. Concentrated problems are fixable problems.
When it is time to ask for help
Some of this is squarely inside your control. Intake accuracy, double eligibility checks, and a code-match step before submission are process changes your team can own.
Some of it is not. Payer-specific rules that change without notice, appeal volume that exceeds your staffing, and denial patterns buried across multiple payers and providers take dedicated attention that most practices cannot carve out of a day that is already full.
A billing partner should be able to show you your denial pattern before they ask you for anything. If a review does not start with your actual numbers, it is a pitch, not a diagnosis.
This is not for every practice. If your denial rate is already low and your AR is clean, keep doing what you are doing. If you are seeing the same denial codes month after month and nobody has the hours to chase them, that is worth a conversation.
Pono works with practices to identify where claims are breaking down and to build the checks that help prevent the same denial from repeating. We start by reading your numbers, not by describing our software.
How Pono Helps
Pono starts with your numbers. We read your last 90 days of denials, show you the pattern behind them, and build the checks that keep the same denial from repeating.
Book a short discovery call and bring your last 90 days of denial codes. We will tell you what we see, whether or not you work with us.
Book a Free AuditRelated reading
Sources
- KFF, Claims Denials and Appeals in ACA Marketplace Plans in 2024: https://www.kff.org/patient-consumer-protections/claims-denials-and-appeals-in-aca-marketplace-plans-in-2024/
- Experian Health, State of Claims 2025: https://www.experian.com/blogs/healthcare/healthcare-claim-denials-statistics-state-of-claims-report/
- American Medical Association, 2025 AMA Prior Authorization Physician Survey: https://www.ama-assn.org/system/files/prior-authorization-survey.pdf